
12 Years of CEO Pay

OVERVIEW
Most executive pay levels analysis focuses on target equity grant values—essentially the accounting value at grant—rather than value realized when equity is earned. Assessing the trends and data underlying take-home equity value can offer boards a fresh perspective on their pay-for-performance alignment and pay program liquidity versus what is communicated to participants in target grant value.
Realized equity outcomes can be found in the Option Exercises and Stock Vested Tables in the CD&A, which reflect the value of an executive’s equity the moment it is off the table or earned. This report contains analysis on “In-Role S&P 500 CEOs” who have served for at least three years (so there is enough time for equity vesting to build up), and “Take-Home” equity compensation, including full-value shares at vest and options at exercise. Importantly, this analysis is differentiated from a “realizable” equity look, which would include the trending value of unvested equity awards.
Key Findings Include:
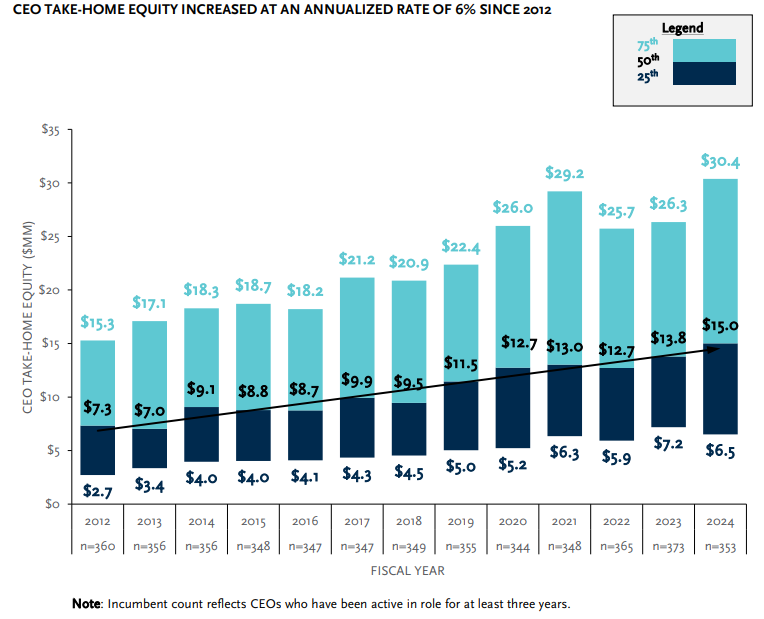
- S&P 500 CEOs, at median, took home $15MM in equity in 2024
- Take-home equity increased 6% annually, largely consistent with target pay increases over time
- At median, CEOs consistently take home more equity than their target grant levels (1.1x-1.4x)1 , due to stock price appreciation over the period observed and PSU payouts that trended slightly above target
- 18% of CEOs have realized multiples above 3.0x target value thanks to dramatic stock movements, situation disruptions like big price surges from the pandemic, or long-held options being exercised
- When excluding those super performers, most CEOs’ realizable equity is within +/- 20% of target.
When analyzed across the entire S&P 500 index, these tables offer a wide and consistent window into realized pay that helps answer a straightforward question: What is the real take-home value of CEO equity? Answering this question can help boards and HR teams better understand the realizable pay landscape and alignment to key relative and absolute metrics.
CEO TAKE-HOME EQUITY HAS INCREASED
- The median take-home equity for in-role S&P 500 CEOs was $15MM in 2024.
- Median take-home equity increased at a 6% annual rate from 2012 – 2024.
- We assessed take-home equity for CEOs with at least three years of tenure to align with typical threeyear vesting cycles, which includes realized value from stock price performance, performance-based equity payouts, and exercised options.
TAKE-HOME EQUITY AS A MULTIPLE OF ANNUAL GRANT IS OFTEN ABOVE TARGET
- At median, CEOs took home more than they were granted over the last 12 years, reflecting the era’s high stock price growth (median 3-year TSR ranged from +4% to +21%) and performance share payouts.
- By analyzing take-home equity as a multiple of target equity, the data highlights the long-term value CEOs can generate for companies, even when target grant values appear stable.
- While vesting schedules created timing differences that may introduce some statistical noise, this lens helps illustrate the broader relationship between realized outcomes vs. intended targets, which are generally stable and consistent at the median of the S&P 500.

EXAMINING HIGH-PERFORMING OUTLIERS
- While median realizable pay was 1.2x of target, a cluster of “super-performers” pulled the median up.
- Removing these high-performing outliers, the majority of CEO payouts were heavily concentrated between 0.8x–1.0x of target, suggesting that most pay programs delivered realized outcomes generally aligned with targets.
- Roughly 20% of CEOs realized multiples above 3.0x, often due to:
- Stock Price Movement: For example, a semiconductor company’s multiple was greater than 3.0x since 2017, driven by stock price growth
- Situational Disruption: For example, a pharmaceutical company’s pandemic-driven surge (143% annual TSR from 2020–2021) led to a 27.3x multiple in 2022, but market normalization reduced it to 0.3x by 2024
- Exercised Option Timing: For example, an entertainment company’s CEO exercised $359MM in options in 2022, resulting in a 35.0x multiple

link


